Have you ever solved a problem only to discover that you fixed a symptom and not the real cause? The answer is most likely yes, but don’t worry, you are not alone! That is why the simple tool this week is the Fishbone Diagram, also known as a “cause and effect diagram”. This tool is used to visualize and structure all the possible causes of a problem. Most importantly, it allows you to get down to the heart of the problem or the root cause instead of just identifying symptoms.
What is it?
The Fishbone Diagram is used to visualize and structure all the possible causes of a problem and allows you to get down to the root cause instead of just identifying symptoms.
How to use the tool
1. Create a short statement that explains exactly what the problem is, and how and when it occurs. Write the problem at the “head” of the fish on the right side.
2. Identify the major cause categories (‘bones’). Here are some examples of typical categories but they should be selected to fit the problem:
- Machine (equipment, technology)
- Method (process)
- Material (includes raw material, consumables, and information)
- People (physical or knowledge work)
- Measurements
- Environment
3. Brainstorm all possible causes and sub-causes under each bone. Ideally, you should do this using post-its so things can be moved around if needed.
4. Highlight the potential root causes that the team agrees are most significant
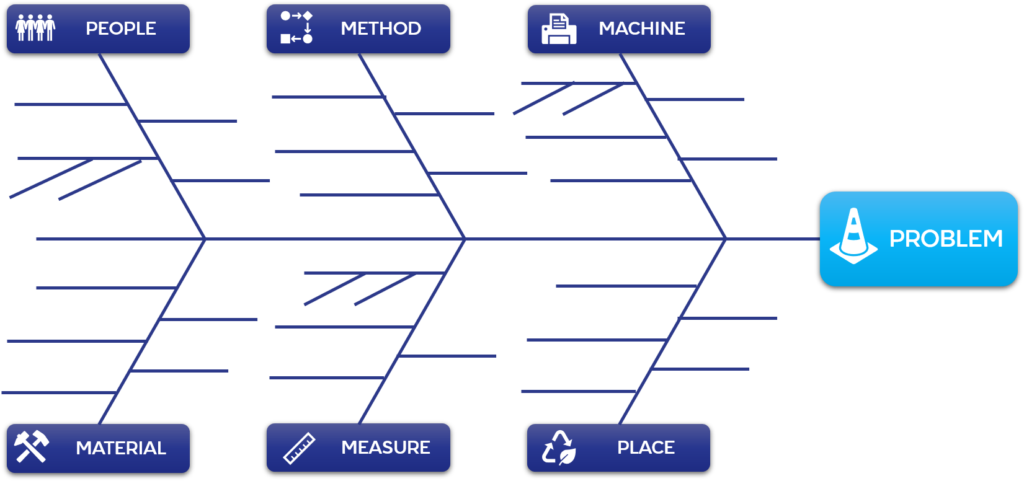
Here is a Fishbone Diagram template.
Feel free to contact us with any questions. We are also available to facilitate a digital session with your team using the Fishbone Diagram.